To calculate share of voice (SOV), you measure your brand's visibility against competitors using this basic formula: (Your Brand Metric / Total Market Metric) × 100. The specific metric you use depends entirely on the channel—it could be keyword impressions in search, ad impressions in paid media, or brand mentions on social platforms. At its core, it's about putting a number on your slice of the conversation.
Why Share of Voice Is Your Most Valuable Growth Metric

Before we get buried in formulas and spreadsheets, let's be clear about one thing: Share of Voice (SOV) is much more than a vanity metric. It's a powerful tool that directly predicts future growth. While market share tells you where you've been, SOV shows you where you're going.
Think of it as the difference between looking in the rearview mirror and looking at a GPS. Market share is a lagging indicator; it's a report card on last quarter's sales. SOV, on the other hand, is a leading indicator that measures your brand's presence in the conversations and spaces that influence tomorrow's buying decisions.
Connecting Visibility to Revenue
The link between SOV and market share is well-documented. A foundational rule in marketing is that if your SOV is greater than your current market share, your market share is likely to grow. This is what we call achieving “Excess Share of Voice” (eSOV).
Research has consistently shown that for every 10 percentage points of eSOV a brand maintains, it can expect to gain approximately 0.5% in market share annually. This provides a direct, quantifiable link between brand-building activities and revenue growth.
This connection turns SOV from an abstract concept into a tangible business driver. When you invest in activities that boost your visibility—whether it's through SEO, PR, or social media—you are actively investing in future sales. For example, a B2B SaaS company that successfully bumps its SOV for key industry terms from 5% to 15% will almost certainly see a lift in qualified leads and demo requests in the following quarters.
A Predictive Tool for Brand Health
Beyond just predicting sales, SOV serves as a diagnostic tool for your brand's overall health and competitive standing. It helps you answer the big strategic questions that other metrics can't touch:
- Are our product launches actually making an impact? A spike in SOV after a launch confirms your message is cutting through the noise.
- Where are competitors outmaneuvering us? A competitor's sudden SOV gain on a specific channel is an early warning sign of a new campaign or strategic shift.
- Is our content strategy resonating? By tracking SOV by topic, you can see which narratives you truly own versus where you are just another voice in the crowd.
I saw this firsthand with a consumer electronics brand. They noticed a steady decline in their organic search SOV. This triggered an investigation that revealed a new competitor was aggressively targeting their branded keywords with paid ads. Without SOV monitoring, they would have only seen the eventual drop in sales much later. By catching that shift in visibility early, they were able to adjust their strategy and defend their position.
Ultimately, mastering how to calculate share of voice isn't just a measurement exercise. It's about building a predictive engine for your business that guides strategic decisions, validates your marketing spend, and paves a clear path to sustainable growth.
Building Your Data Foundation for an Accurate SOV
Your share of voice calculation is only as good as the data fueling it. Let's be honest: if you put garbage in, you'll get garbage out. Flawed or incomplete data doesn't just give you a fuzzy number; it leads to misleading insights that can send your entire strategy off a cliff.
Think of it like building the foundation for a skyscraper. If you rush it or use shoddy materials, everything you build on top is at risk of collapsing. The same goes for your SOV measurement.
The very first thing you need to do is get brutally honest about who you're actually up against. Don't just list your top three direct rivals and call it a day. You need to think about topic competitors—these are the brands that might not sell the same thing you do, but they're fighting you for the same audience attention on specific keywords or in online conversations.
For example, a project management software company isn't just competing with other SaaS tools. They're also up against major productivity blogs and even news publications for search visibility on a term like “how to improve team workflow.” If your view of the competition is too narrow, you'll end up with an artificially inflated SOV that hides real threats just under the surface.
Data for Organic Search SOV
When you're measuring SOV in organic search, you're trying to figure out how much of the search engine results page (SERP) you really own for the keywords that matter. Raw ranking numbers are almost meaningless on their own.
What you're after are metrics that reflect true visibility, like estimated impressions or click-through rate (CTR) visibility. These go beyond a simple rank by factoring in how many people are searching for a keyword and how likely they are to click on your result. A #1 ranking for a keyword with 10 monthly searches is pocket change compared to a #5 ranking for a keyword with 10,000.
Here's the data you'll need to pull together:
- Target Keyword List: A carefully curated list of the non-branded, commercial, and informational keywords your audience is actually using.
- Your Brand's Rankings: Where you currently stand for every keyword on that list.
- Competitor Rankings: The same ranking data, but for your defined competitors.
- Search Volume: The average monthly search volume for each keyword.
- Estimated CTR Curve: A model that assigns a likely click-through rate to each SERP position (e.g., position 1 gets 28% of clicks, position 2 gets 15%, and so on).
This is where tools like Ahrefs, Semrush, or Sistrix become indispensable. They do the heavy lifting, automating data collection and often providing their own Visibility Score or Share of Voice metric. This is your cornerstone for figuring out how to calculate share of voice in the SEO world.
Metrics for Social Media and PR
For social media and PR, the game changes. You're shifting focus from SERP visibility to the volume of conversation. Here, you're measuring your brand's slice of the discussion happening across social platforms, blogs, forums, and news outlets.
The core metric is simply brand mentions. It's a raw count of how many times your brand, products, or key hashtags are mentioned compared to your competitors over a set period.
A critical mistake is treating all mentions as equal. One mention in a major industry publication can have more impact than 100 mentions on spammy Twitter accounts. This is why pairing mention volume with sentiment analysis is crucial for a complete picture.
Your data collection checklist should include:
- Brand Mentions: The total number of times your brand is mentioned.
- Competitor Mentions: The same count for each of your key competitors.
- Sentiment Analysis: The breakdown of mentions into positive, neutral, or negative.
- Reach/Impressions: The potential audience size of those mentions.
Platforms like Brandwatch or Talkwalker are purpose-built for this kind of analysis. If you're on a tighter budget, you can set up Google Alerts for your brand and competitor names to get a basic, free feed of media mentions. Getting the nuances of mention tracking right is vital, and our guide on mentions, citations, and sentiment offers a much deeper dive into this process.
Capturing Paid Media Impression Share
In the world of paid ads (PPC), thankfully, there's a straightforward metric for SOV: Impression Share (IS). This data is sitting right inside platforms like Google Ads and Microsoft Advertising, just waiting for you.
Impression Share tells you what percentage of the total available impressions your ads actually received. Simple. If your ads were eligible to show up 1,000 times but only appeared 700 times, your Impression Share is 70%. The other 30% either went to your competitors or was lost because your budget was too low or your ad rank wasn't good enough. Tracking this gives you a clean, quantifiable measure of your visibility in the paid arena.
Alright, you've got your data sources lined up. Now it's time to roll up our sleeves and get into the actual calculations.
While there's a universal formula for Share of Voice, the real trick is knowing which metric to plug in for each channel. The core idea is simple, but its application is what separates a vanity metric from a strategic one.
The basic framework you'll be using is:
SOV (%) = (Your Brand Metric / Total Market Metric) × 100
Think of this as your Swiss Army knife. Whether you're digging into search results, social media chatter, or ad campaigns, this formula is your starting point.
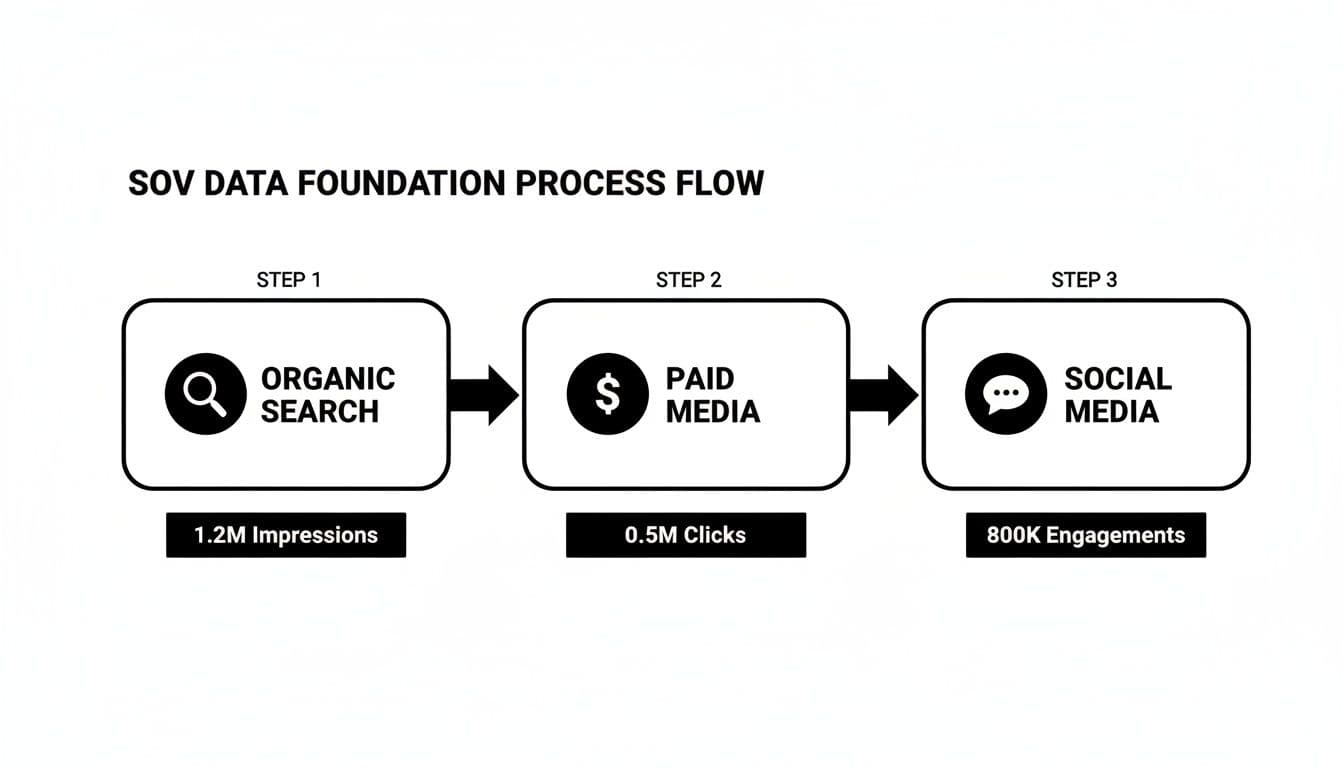
As the diagram shows, each channel—organic, paid, and social—has its own “currency” of visibility. To get the full picture, you have to measure each one on its own terms. Let's break down exactly how to do that.
Calculating Organic Search SOV with Keyword Visibility
For organic search, the gold standard is keyword visibility, sometimes called share of search. This goes way beyond just tracking your rank. It layers in search volume and estimated click-through rates (CTR) to give you a realistic model of the actual traffic you're capturing from the SERPs.
Let's imagine a B2B SaaS company, “InnovateHub,” is targeting the keyword “agile project management tools,” which gets 5,000 searches a month.
Here's how you'd set up a simple calculation in a spreadsheet:
- First, list your target keywords and their monthly search volume (MSV).
- Next, assign a CTR percentage for each ranking position. You can use industry benchmarks (e.g., Position 1 gets ~28%, Position 2 gets ~15%).
- Multiply each keyword's MSV by the CTR for your ranking position to find your Estimated Clicks.
- Add up the Estimated Clicks for all your keywords to get your Total Brand Clicks.
- Do the same for every competitor you're tracking.
- Finally, sum all clicks (yours and your competitors') to get the Total Market Clicks.
Now, just plug those numbers into the SOV formula:
InnovateHub SOV = (InnovateHub's Total Clicks / Total Market Clicks) × 100
If InnovateHub earned 500 clicks and the total market clicks were 4,000, their SOV for this keyword set is 12.5%. This is how to calculate share of voice in a way that truly reflects user behavior, not just where you happen to rank.
Measuring Paid Media SOV with Impression Share
When it comes to paid channels like Google Ads or display, the math gets a lot more straightforward. The metric you're looking for is Impression Share, and it's available right inside your ad platforms. It tells you the percentage of impressions your ads actually received out of the total they were eligible for.
Key Insight: Impression Share is the cleanest proxy for paid visibility. If your Impression Share is 60%, you're capturing most of the available ad views. But it also means your competitors are still snapping up the other 40% of that screen time.
For paid media, your SOV is essentially your Impression Share. This impression-based model also works across channels. For instance, a classic example showed Brand B generating 150 million impressions against a category total of 1 billion, securing a 15% SOV with the formula (150M / 1B) × 100. This variant—(Brand impressions or GRPs / Total category impressions or GRPs) × 100—is a staple in PPC and display advertising. Brands with a high impression SOV often see 20–30% more conversions.
Using Mention Volume for Social and PR SOV
On social media and in the press, SOV is all about your share of the conversation. Here, your go-to metric is mention volume. You'll use a social listening tool to track how many times your brand is mentioned compared to your competitors over a set period.
Let's go back to InnovateHub. They're tracking mentions across Twitter, LinkedIn, and key tech blogs. In one month, the data comes back like this:
- InnovateHub: 2,000 mentions
- Competitor A: 4,500 mentions
- Competitor B: 3,000 mentions
- Competitor C: 500 mentions
The total market conversation adds up to 10,000 mentions.
InnovateHub SOV = (2,000 Mentions / 10,000 Total Mentions) × 100 = 20%
That gives InnovateHub a clear 20% share of the conversation. It's a direct and powerful way to measure the buzz from your PR and content marketing efforts.
Share of Voice Calculation Methods by Channel
The right approach always depends on the channel you're analyzing and what you're trying to achieve. This table compares the different SOV models, their data needs, and where they fit strategically:
| Channel | Primary Metric | Formula | Required Tools | Strategic Focus |
|---|---|---|---|---|
| Organic Search | Keyword Visibility | (Your Brand Clicks / Total Market Clicks) × 100 | SEO Platforms (Ahrefs, Semrush) | Owning topic authority and capturing high-intent search traffic |
| Paid Media | Impression Share | Your Impression Share (%) | Google Ads, Microsoft Advertising | Dominating ad placements and maximizing visibility against direct bidders |
| Social Media | Mention Volume | (Your Mentions / Total Mentions) × 100 | Social Listening Tools (Brandwatch) | Gauging brand awareness, buzz, and the impact of content and PR |
| Traditional Media | Gross Rating Points (GRPs) | (Your GRPs / Total Market GRPs) × 100 | Media Monitoring Services | Measuring reach and frequency in broadcast and print advertising |
By applying these channel-specific formulas, you're trading a vague sense of “brand presence” for a hard, quantifiable metric. This granular understanding of how to calculate share of voice is the critical first step toward actually being able to influence it.
The Next Frontier: Calculating SOV in AI Conversations

The methods we've covered for search, social, and paid media are all essential, but they only tell part of today's story. A new battleground for brand presence has opened up—one that starts before a user even lands on a search results page. This is the world of AI conversations.
Millions of people now turn to AI assistants like ChatGPT, Gemini, and Perplexity for answers and product recommendations. When a user asks an AI, “What are the best CRMs for a small business?” it depends on the system: some answers are grounded in web sources, some rely on model knowledge; either way you can measure brand presence.
This shift introduces a new metric we have to start tracking: AI Visibility. It measures your brand's presence within the answers AI assistants generate. If your brand isn't mentioned, cited, or recommended in these conversations, you're invisible to a huge and growing part of your audience. Think of it as the new, upstream SOV.
Why AI Visibility Is the New SOV
Tracking your brand's footprint in AI answers isn't optional anymore; it's a leading indicator of future brand discovery. When an AI cites your brand or links to your content, it acts as a powerful, third-party endorsement that carries serious weight with users.
Here's how to think about the difference:
- Search Engine SOV measures your visibility when users are actively looking for information.
- AI Visibility measures your influence on the knowledge base that creates the answers users get.
If you don't show up in AI responses, you're missing a critical chance to shape perception and make it into the initial consideration set. Meanwhile, your competitors could be cementing their status as the default answer in your category.
From Opaque Answers to Quantifiable Metrics
The black-box nature of large language models makes this new form of SOV incredibly difficult to calculate by hand. You can't just “rank” for an AI prompt. The answers are dynamic, often personalized, and can change from one moment to the next.
This is where specialized platforms come in. They turn these abstract AI conversations into a stream of quantifiable data by automating the process of querying different AI models at scale with prompts relevant to your business.
By running these prompts consistently over time, you can finally collect the historical data needed to measure visibility in this new channel. Unlike traditional SOV, AI visibility benefits from separating a few distinct metrics:
- AI Presence Rate = answers with your brand / total answers — how often you show up at all.
- AI SOV (mentions) = your mentions / total mentions (you + competitors) × 100 — your true share of the cited market.
- AI SOV (weighted) = your weighted score / sum of weighted scores × 100 — weights by position, mention type (“recommended” vs “listed”), and citations for a quality-adjusted view.
This approach gives you a clear metric for understanding your brand's footprint in the AI era. It lets you see where the gaps are, identify which content and sources are driving AI recommendations, and take strategic action to make sure your brand is part of the conversation.
Automating AI Visibility Measurement
Specialized tools are essential for this. Back in the early 2000s, Target pulled off a marketing masterstroke by buying 100% Share of Voice in a special issue of The New Yorker. It was a brilliant move for a static medium. Today, platforms like Genwolf are the game-changers for the dynamic world of AI.
Instead of manual spot-checks, Genwolf tracks AI visibility across models like ChatGPT and Gemini by running custom prompts for you every single day. You can get a much deeper look into the power of AI visibility and why it's so important strategically.
Imagine a tool like Genwolf detects your brand in 40% of relevant AI responses (AI Presence Rate) and, among all cited brands, you account for 40 mentions out of 100 total (your + competitors) — that's 40% AI SOV. Add weighting for position and mention type, and you get a richer, quality-adjusted picture. This is actionable intelligence you can use to guide your PR and content efforts.
Tools built for this purpose track your brand's share of mentions over time, pinpoint which competitors are showing up in answers, and even reveal the source domains the AI is using to formulate its responses. This workflow transforms abstract AI chats into concrete data for true SOV analysis.
Turning SOV Into Action
Right, you've done the hard work of calculating your Share of Voice. Now what?
Getting your SOV numbers is a bit like a doctor giving you a lab report. The numbers themselves are just data. The real value is in the treatment plan. A high or low SOV figure is meaningless until you decide what to do about it. This is where you turn measurement into a real competitive edge.
Those SOV calculations are your strategic roadmap. They show you exactly where you're winning, where you're losing, and most importantly, why. Every channel-specific metric is a clue, pointing to an opportunity or a threat that needs a specific response.
Interpreting Your Channel-Specific SOV
First things first: look past the aggregate number. You need to dissect your SOV by channel. It's easy for a strong overall SOV to hide a glaring weakness on a platform that really matters to your buyers. Likewise, a dismal total score might just be one or two areas pulling everything down.
Let's say you have a massive social media SOV, but a quick sentiment check shows it's all negative. That's not a win; it's a five-alarm fire. Your strategy isn't to get more mentions, but to change the conversation entirely. You'd need to pivot your content to address customer pain points, amplify positive user stories, and get serious about reputation management.
Or what if a competitor is absolutely crushing you in organic search SOV for your most valuable, bottom-of-the-funnel keywords? This is a direct hit to your pipeline.
Your move here has to be a targeted, aggressive SEO counter-offensive. This isn't about vague “SEO best practices.” It's about a deep competitive analysis of their top pages, finding the content gaps, and building a plan to create something demonstrably better. You have to earn the visibility they currently own.
Each scenario demands a different playbook. Your job is to move from just knowing the score to making the plays that will change it.
Setting Realistic SOV Goals
Now that you know where you stand, you can set goals that actually make sense. A classic mistake is picking an arbitrary number out of thin air, like “we want 50% SOV.” A much smarter way is to anchor your goals to your market position and your competitors' strength.
A great framework for this is the concept of Excess Share of Voice (eSOV). This is simply the gap between your SOV and your Share of Market (SOM). Decades of research show that maintaining an SOV that is 5 to 10 percentage points higher than your market share consistently leads to growth.
- If you're a market leader: Your game is defense. You need to maintain your eSOV to protect your turf. Any dip in your SOV is an early warning that a competitor is making a move on your territory.
- If you're a challenger: Your game is offense. You need to be aggressive. Pinpoint a channel where the leader is weak or where you have a unique advantage, and pour your resources into achieving a big eSOV in that specific niche.
- If you're a new entrant: Forget about the overall market SOV. Your goal is just to get on the board. Focus on dominating a very specific, long-tail topic or a new channel like AI assistants, where the incumbents might be slow to adapt. For more on this, you can learn about improving your brand's AI visibility and find a new competitive angle.
Tie these goals to a specific timeframe—quarterly or semi-annually works well. This creates a clear cadence and turns SOV from a one-off audit into a living, breathing performance metric.
Building a Simple Reporting Dashboard
Finally, you need to show your work. You have to communicate these insights to leadership in a way that proves marketing isn't just a cost center. Ditch the dense spreadsheets and 50-page slide decks. A simple, one-page dashboard is infinitely more powerful.
Your dashboard should be all about clarity and trends, not just raw numbers. Use visuals to tell a story that can be understood in a single glance.
Essential Dashboard Components:
- Overall SOV Trend: A line graph showing your total SOV against your top two competitors over the last six months.
- Channel Breakdown: A bar chart comparing your SOV across search, social, paid, and AI channels.
- Key Strategic Wins/Losses: A bulleted list highlighting a major win (e.g., “Overtook Competitor X for ‘best project software’”) or a key threat (e.g., “Competitor Y launched a major campaign, capturing 20% of paid SOV”).
- Action Plan: A brief, no-nonsense summary of the top two strategic actions you are taking based on the data.
This format connects your measurement directly to your strategy and its results. It proves you don't just know how to calculate share of voice—you know how to use it to move the business forward.
Frequently Asked Questions
What's the Difference Between Share of Voice and Market Share?
Share of Voice (SOV) is all about your brand's presence. It's a measure of how much of the conversation you own, from ad impressions to social media chatter. Think of it as a leading indicator—it predicts future performance by measuring your current visibility and influence.
Market Share (SOM), on the other hand, is a lagging indicator. It simply tells you what percentage of total sales your brand captured over a previous period. It's a report on past success.
A core principle in marketing is that if you can consistently maintain a Share of Voice that's higher than your Share of Market, you're setting yourself up for growth. Your visibility today directly fuels your sales tomorrow.
What Is a Good Share of Voice to Aim For?
There's no magic number here. A “good” SOV is completely relative.
For a startup just entering the scene, grabbing even 10% SOV in a specific niche could be a massive win. But for an established market leader, seeing their SOV dip below 40% could be a five-alarm fire, signaling a major competitive threat.
A much better way to think about it is aiming for “Excess Share of Voice” (eSOV). You calculate this by simply subtracting your market share from your share of voice (SOV − SOM). A positive eSOV is one of the strongest predictors of future market share growth. The real goal isn't just a big number; it's keeping your SOV consistently ahead of your slice of the sales pie.
How Can I Calculate SOV on a Limited Budget?
You don't need a six-figure software budget to get a solid directional read on your SOV. While the big enterprise tools offer incredible precision and automation, you can piece together a pretty good picture with free or low-cost resources.
Here's a shoestring-budget approach that works well:
- Brand Mentions: Set up Google Alerts for your brand name and your top two or three competitors. It's free, automatic, and a great way to monitor mentions across news sites and the broader web.
- Organic Search: Your own Google Search Console is a goldmine. Use it to track impression data and your average ranking for the keywords that matter. It won't show you competitor data, but it gives you a clear baseline of your own search footprint.
- Social Media: This one requires some elbow grease. You can track SOV manually by regularly searching for key hashtags and brand mentions on the one or two platforms where your audience actually lives.
Sure, this approach is more labor-intensive, but it delivers a valuable snapshot without touching your credit card. The key is to be strategic and focus your efforts where they'll make the biggest difference.
Are you ready to stop guessing about your brand's visibility in the new era of AI? Genwolf is an AI visibility platform that shows you exactly where and how AI assistants like ChatGPT and Gemini mention your brand. Turn opaque AI conversations into actionable metrics and get ahead of the competition. Start your 7-day free trial and see what you've been missing.